Inventory Item Details
The Inventory Item Details page is the source of truth for one inventory item, lot, or tag. Use it when your team needs to answer what is on hand now, where the item came from, which production jobs or orders touched it, what it costs, and what action should happen next.
For B2B manufacturers and wholesalers, this page helps turn a warehouse tag into a record that operations, sales, finance, and export teams can all read. It reduces the back-and-forth that happens when someone asks, "Where did this lot go?"
Screenshot space
Inventory item overview
Add a screenshot of the item details header showing the tag ID, product identity, status badges, on-hand values, original values, location, and More Actions menu.
Open an Item Details Page
You can open an item details page from several places:
- Go to Inventory -> All and select a product.
- Find the item in the inventory items table.
- Click View Details on the item row.
You can also open an item directly from universal search, the Find Inventory Item modal, QR or barcode tags, production records, order records, shipment records, and linked product views when those workflows show the item.
Read Current Stock and Identity
Start at the top of the page when you need fast situational awareness. The header and summary areas help you confirm that you are looking at the right physical stock before changing production, pricing, or fulfillment plans.
Use this area to review:
- Tag ID and product label or SKU
- product type, shape, size, and quality
- color, shown with a dot in its shade, or as a labeled badge when the color has no single hue, such as Two-Tone
- filled item attribute values, such as certificate, batch, or fitment details; empty attributes are hidden, so the page shows only what the item actually carries
- on-hand weight and on-hand pieces
- original weight and original pieces recorded at intake or creation; admins can correct these with Edit Original Quantity and Weight
- current status, such as on hand, in production, reserved, shipped, returned, rejected, scrapped, or consumed
- last movement, warehouse location, and rack or bin when rack tracking is enabled
- stockout or low-stock actions when the item needs replenishment through production or purchasing
To compare attribute values across several items, use Show attributes in an inventory table. The table search finds filled values even when those columns are closed.
This is useful for daily warehouse review because the team does not need to open separate spreadsheets, messages, and order screens just to confirm what a tag represents.
Follow Source-to-Customer Traceability
Use traceability sections when someone asks where a lot came from, where it was used, which customer order it supported, or what happened to rejected, scrapped, or returned quantity.
The Inventory Flow Graph shows the path around the item, including source inventory, production jobs, output inventory, orders, shipments, returns, rejections, scrap, and waste when those records exist. This gives managers a source-to-customer view without manually stitching together production and commercial records.
The Activity Timeline shows item movement in order. Filter the timeline when different teams need different answers:
- production teams can focus on job issue, receipt, rejection, scrap, and waste events
- sales and customer service teams can focus on order, reservation, shipment, delivery, and return events
- finance teams can connect movement to purchasing, selling, costing, and margin review
Screenshot space
Flow graph and activity timeline
Add a screenshot showing the inventory flow graph beside or above the activity timeline, with filters for production, orders, and shipments.
Tip
Use the flow graph for the whole story. Use the timeline when you need the exact sequence of events.
Review Production, Yield, and Loss
For items that entered or left production, the details page helps production managers and owners understand how efficiently material converted into usable stock.
Review production sections to see:
- origin yield and waste for the lot
- downstream production jobs that used the item
- production disposition, including received, rejected, scrapped, and waste quantities
- yield waterfall views that show where weight or pieces changed
- job-level progress that can reveal stalled work or abnormal loss
Yield is the share of issued weight that came back from a job as good, received output:
The Origin Yield card, the yield shown for each job in the waterfall, and the yield on the Inventory Flow by Type cards all use this calculation. Only received output counts toward yield, so rejected, scrapped, and wasted weight all lower it.
For example, a job issued 100 g that returns 82 g received, 5 g rejected, 8 g scrapped, and 5 g of waste has a yield of 82%.
Yield always divides by issued weight, even when the job also has a requested weight. That is why it can differ from the job's progress percentages, which use requested weight when your team set one.
This matters when margins depend on material recovery. A small loss can look acceptable on one job but become expensive across repeated jobs, locations, or customers.
Screenshot space
Yield and production disposition
Add a screenshot showing origin yield, production disposition, yield waterfall, and job progress for an item that has moved through production.
Inventory Flow by Type Tooltip
The Inventory Flow by Type cards group the items in this item's flow by inventory type, such as Rough or Preform. Hover over a card to see its full details, or click the card to keep them open while you look at other cards.
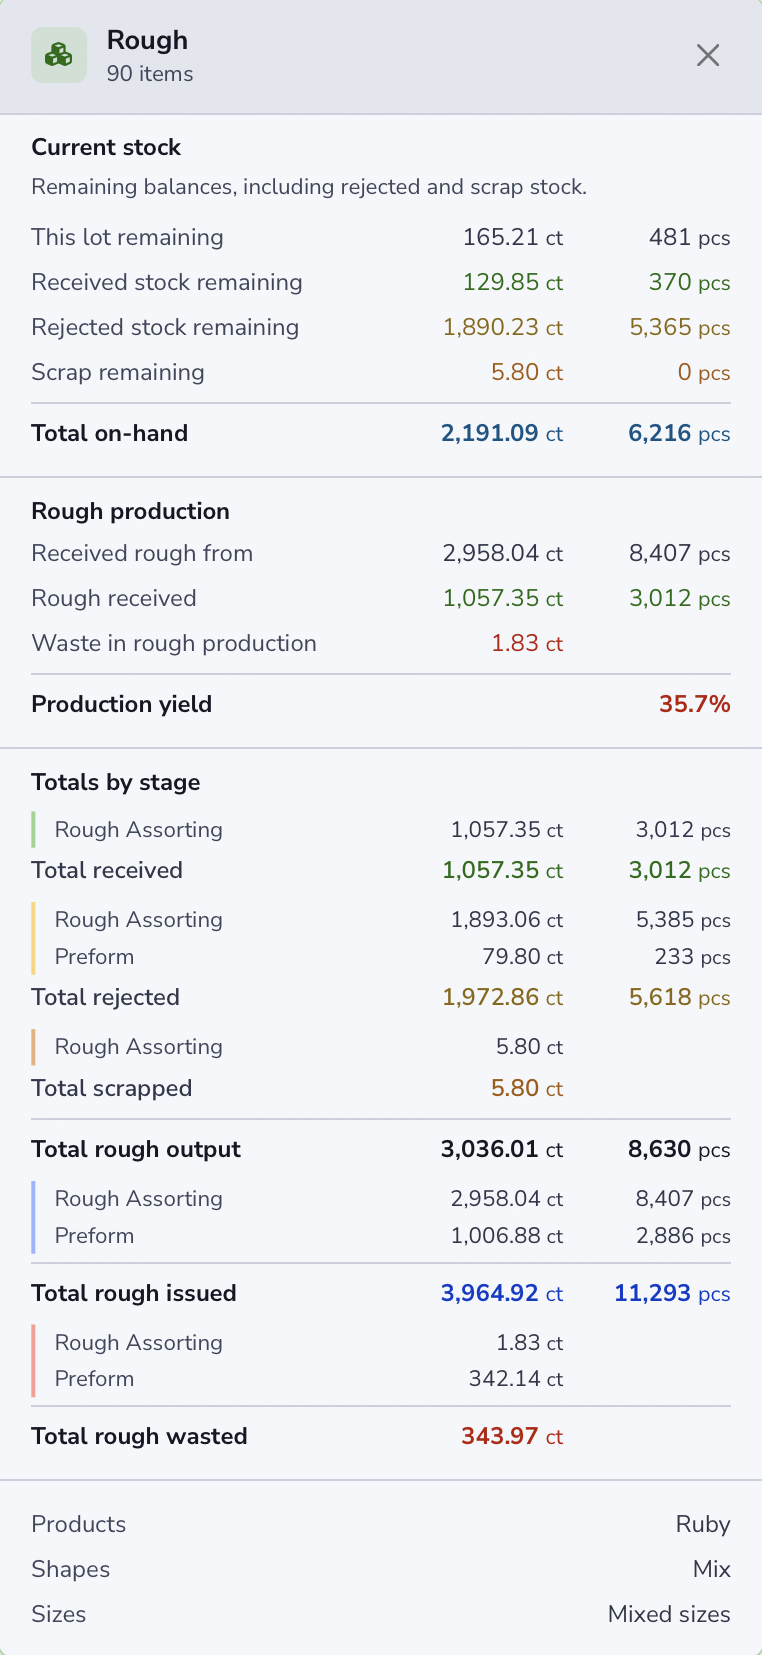
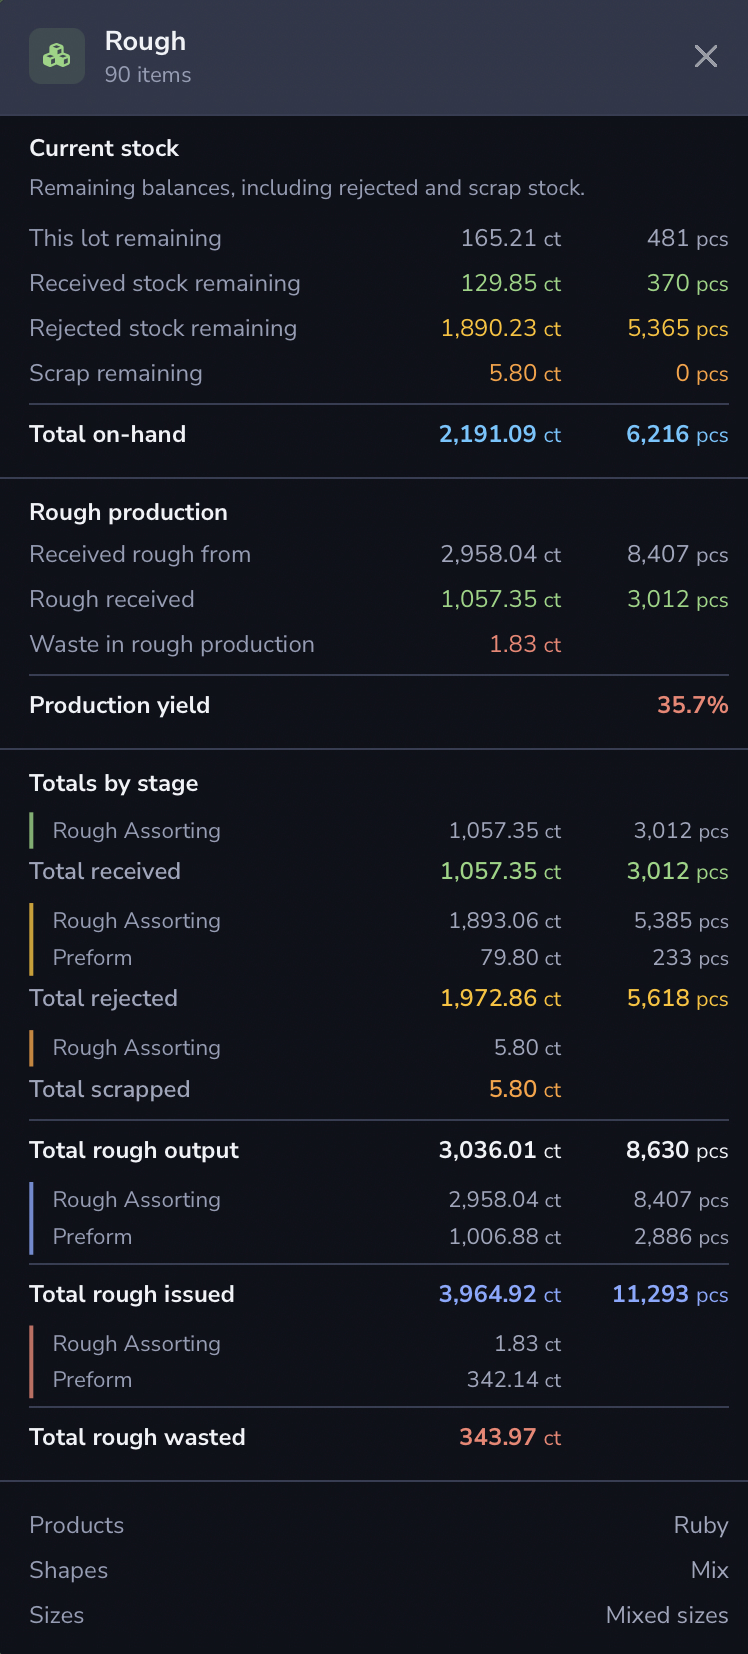
The details have three parts:
- Current stock shows what is still on hand for the type: this lot, plus received, rejected, and scrap stock. Total on-hand includes rejected and scrap stock.
- The production section, named after the type, covers the jobs whose main received output is that type. Its first row, Received rough from in the example, is the weight issued into those jobs. Production yield is the weight those jobs received back as this type, divided by that issued weight.
- Totals by stage lists received, rejected, and scrapped weight stage by stage, then the type's total output. Below that, it shows how much of the type was issued into later jobs and how much those jobs wasted.
In the example, the jobs that produced Rough were issued 2,958.04 ct and returned 1,057.35 ct of received Rough, so production yield is 35.7%.
Totals by stage are history totals, so material that was reprocessed can be counted again. The last rows list the products, shapes, and sizes in the group.
Connect Orders, Shipments, and Returns
When an item is reserved, sold, shipped, or returned, the item details page helps customer-facing and warehouse teams connect physical stock to commercial activity.
Use the order and shipment areas to review:
- linked sales and purchase order activity
- selected inventory on order line items
- shipment status and tracking details
- shipped quantity or weight compared with returned quantity or weight
- recent return patterns for the item or lot
This reduces "where is my shipment?" and "which order used this tag?" follow-up because the item record keeps the operational path close to the physical stock record.
Check Pricing, Margin, and Cost Components
Use Pricing Details to review the prices available to your role. Admins can see Unit Cost Price, Unit Sell Price, and Unit Retail Price. Managers can see Unit Sell Price and Unit Retail Price. Members can see Unit Retail Price. Existing inventory and location access still applies.
Unit Retail Price is the optional manufacturer's suggested retail price (MSRP), expressed in the item's currency and price basis. It is a unit amount, not the total retail value of all stock on the record. A blank means unset; zero is valid.
Admins can compare:
- Unit Cost Price, Unit Sell Price, and Unit Retail Price
- currency and Price Basis, such as per piece or per gram
- estimated cost from linked cost components
- per-unit profit or margin signals when available
Use the same currency and price basis when comparing prices and estimates. Retail Price is a reference and does not change Cost Price, Sell Price, or profit calculations.
When your team uses Cost Components, material, labor, freight, overhead, duties, service charges, and market-linked rates can roll up to a total estimated cost for the item. This helps pricing decisions stay tied to what the item actually contains, not just a final number typed into a quote or order.
Only admins can change prices, currency, or price basis. Open More Actions > Edit Pricing, or use the edit icon in Pricing Details, then click Save Pricing after reviewing the values. See Edit Inventory Pricing for the full steps.
Admins can also choose Pricing Details > Set as Retail Price to apply the saved component estimate using the item's price basis. Saving components alone does not update Retail Price. See Set Retail Price from Cost Components.
Viewing Retail Price does not grant CSV export access. Both inventory export options remain admin-only.
Screenshot space
Pricing and cost components
Add an admin-view screenshot showing Unit Cost Price, Unit Sell Price, Unit Retail Price, the saved component estimate, and Set as Retail Price in Pricing Details.
Prepare the Item for Trade and Handoffs
Global teams need the same item record to support warehouse handling, customer communication, and export documents. The details page brings trade-ready identity fields close to movement and costing history.
Use the page to review and maintain:
- HS code information for export and compliance workflows
- product attributes such as type, shape, size, quality, and color
- warehouse location and rack for picking and cycle counts
- weight unit, such as grams, carats, ounces, or another unit used by your team
- tag ID and scannable labels used by warehouse, production, sales, and export teams
If the item does not have an HS code, eligible users can use AI assistance from the item details page. See Using AI to Retrieve HS Codes for an Inventory Item.
Use AI Assistance
AI tools on and around the item details page help teams scan information faster and prepare cleaner item records.
Depending on your plan, role, and available item data, Loupe Factory can help with:
- an AI-generated item summary for managers or new team members
- summarized notes that turn messy internal handoffs into cleaner context
- HS code suggestions for export review
- studio-style item images for catalogs, B2B portals, and sales sheets
- shopper-facing storefront copy drafted from the item's own attributes
For image workflows, see AI Inventory Image Editing. For shopper-facing copy, see Storefront Descriptions.
Screenshot space
AI summary and image support
Add a screenshot showing the AI item summary, summarized notes, HS code assistant, or inventory image area, depending on which view you want to document first.
Actions You Can Take from the Page
The item details page does more than report. Most next steps start from the More Actions menu in the page header.
Common actions include:
- edit the inventory item record
- edit original quantity and weight when an admin needs to correct creation-time values
- update the inventory image
- open the Media Gallery, whose menu badge shows the current file count, to upload or link supporting photos, bench videos, lab certificates, spec sheets, and 3D CAD models, or to turn the main image into product shots with AI
- write or update the item's storefront description
- view, print, or edit the tag ID when your plan and role allow it
- start production from the item
- create a sales or purchase order connected to the item
- review or update cost components
- open the parent product record
Use these actions when the page has already given enough context to make the next step clear. For example, a warehouse user may print the tag, a production manager may start a new job, and a finance user may review cost components before pricing the item on an order.
Role-Based Value
| Team | What to review |
|---|---|
| Owner or CFO | Margin signals, cost breakdown, yield loss, return trends, and item-level profitability. |
| Production manager | Job progress, source usage, received output, rejection, scrap, waste, and yield waterfall. |
| Warehouse | On-hand quantity, weight, location, rack, tag ID, status, and stockout actions. |
| Sales or customer service | Reserved status, order history, shipment status, tracking, and returns. |
| Export or compliance | HS code, item attributes, origin, movement history, and supporting traceability. |
Recommended Review Flow
When you open an item details page, review it in this order:
- Confirm the tag ID, product identity, status, and on-hand values.
- Check location and rack before asking warehouse staff to pick or count the item.
- Use the flow graph to understand where the item came from and where it went.
- Use the timeline to confirm the exact order of production, order, shipment, return, or adjustment events.
- Review yield and loss if the item was issued to or received from production.
- Review linked orders, shipments, and returns if the item is customer-facing.
- Review the prices your role can see, including Unit Retail Price as a reference. Admins can compare all three unit prices with the component estimate, using the same currency and price basis, before quoting or repricing.
- Use the relevant action only after the record confirms what should happen next.
Next Steps
- Inventory Management: Add, edit, search, and categorize inventory items.
- Media Gallery: Attach unlimited supporting photos, videos, PDFs, and 3D CAD files to items and product types, or generate product shots with AI.
- Cost Components: Break item value into materials, services, charges, rates, and quantities.
- Inventory QR & Barcode Tags: Use printed or scannable tags to connect physical stock to the item record.
- Production Tracking: Issue inventory into production jobs and receive completed output back into stock.